Analytics and Reporting
KPI Dashboard
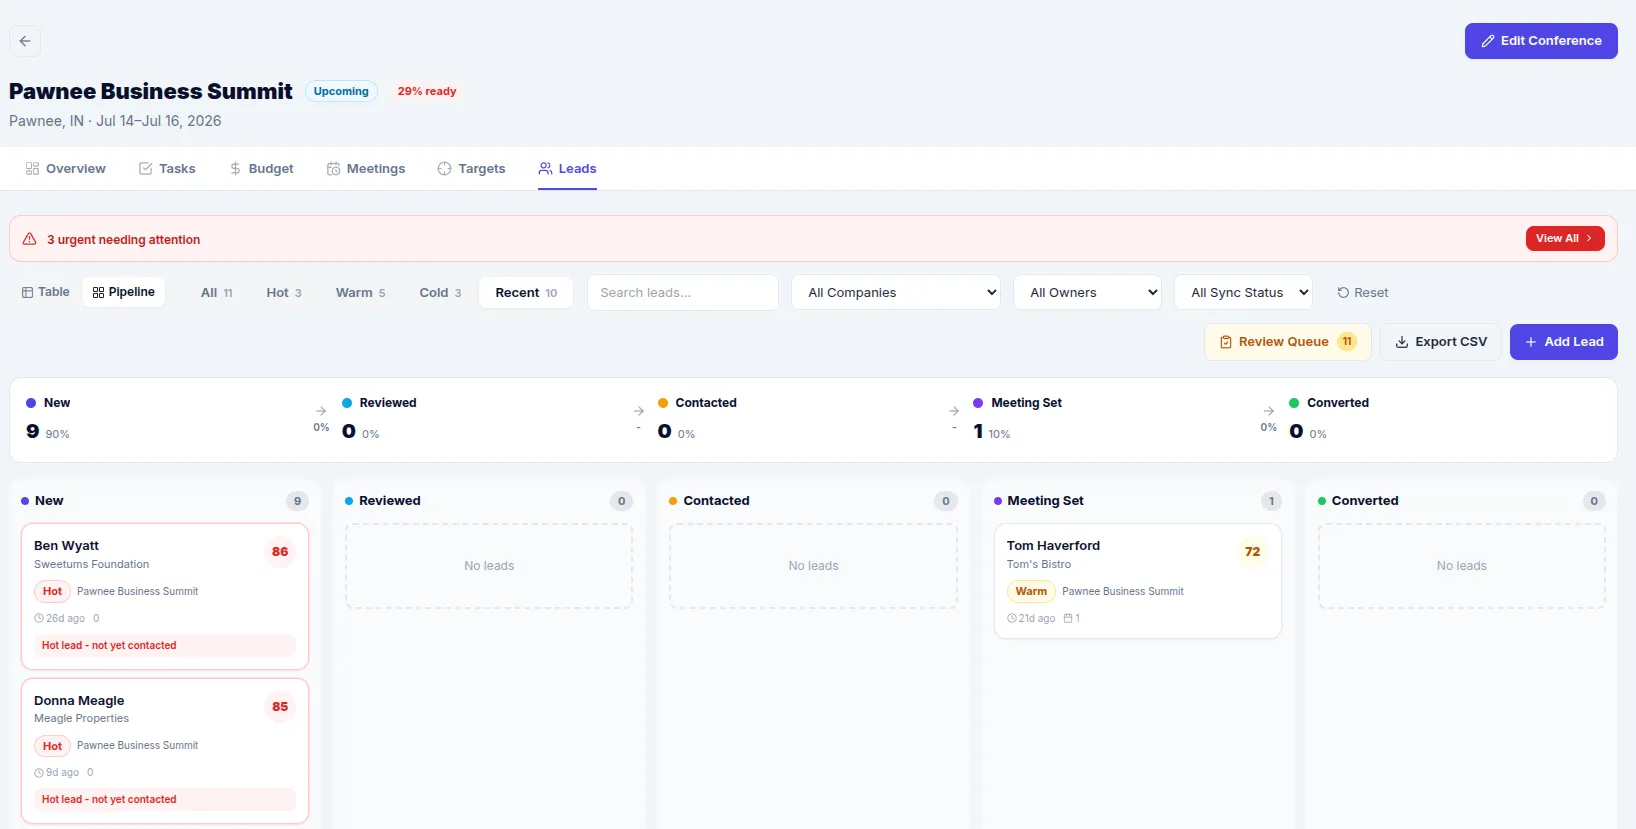
The moment you log in, Conference Hero's KPI dashboard shows you what matters: total leads captured, task completion percentage, and budget spend across all active events. Cards update in real time as your team works on the conference floor, so you always have an accurate picture without refreshing or pulling reports manually.
Each KPI card links to a detailed view. Click on the leads count to see the full lead list. Click on budget spend to drill into category breakdowns. The dashboard is a starting point, not a dead end.
Lead Flow and Pipeline Charts
Visualize your leads across multiple dimensions. The Leads by Conference chart shows a stacked bar breakdown of HOT, WARM, and COLD contacts at each event. The Cumulative Leads timeline tracks capture velocity over time. Leads by Owner shows how work is distributed across your sales team, and Leads by Company highlights which accounts have the most contacts in your pipeline.
If you're using the HubSpot integration, the Leads by Deal Stage chart maps your event contacts to HubSpot pipeline stages, giving you a clear view of how conference leads progress through your sales process.
Post-Event ROI Reports
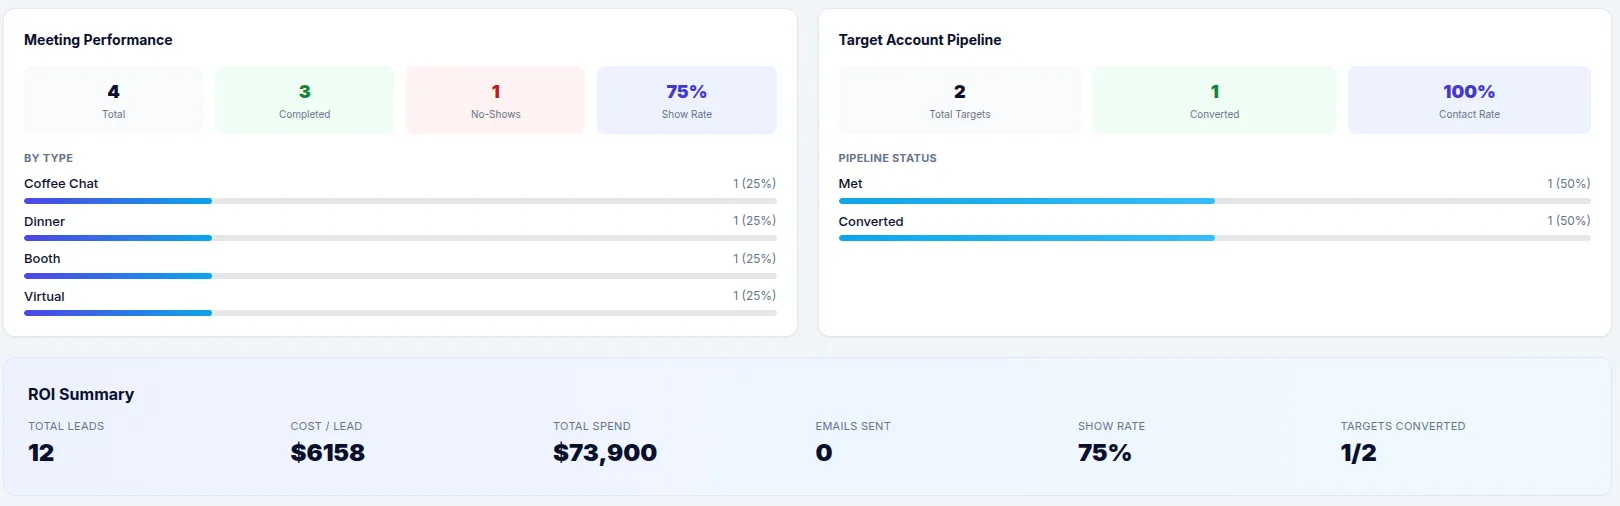
After a conference wraps, generate a detailed ROI report that ties your spending to outcomes. The report calculates cost-per-lead, revenue attribution, and compares actual results against your pre-event goals. Use these numbers in your post-event debrief to show leadership exactly what the conference delivered.
ROI reports pull data from your budget, lead, and campaign records automatically. There's no manual data assembly required. Run the report, export it as needed, and present it with confidence.
Cross-Event Benchmarking
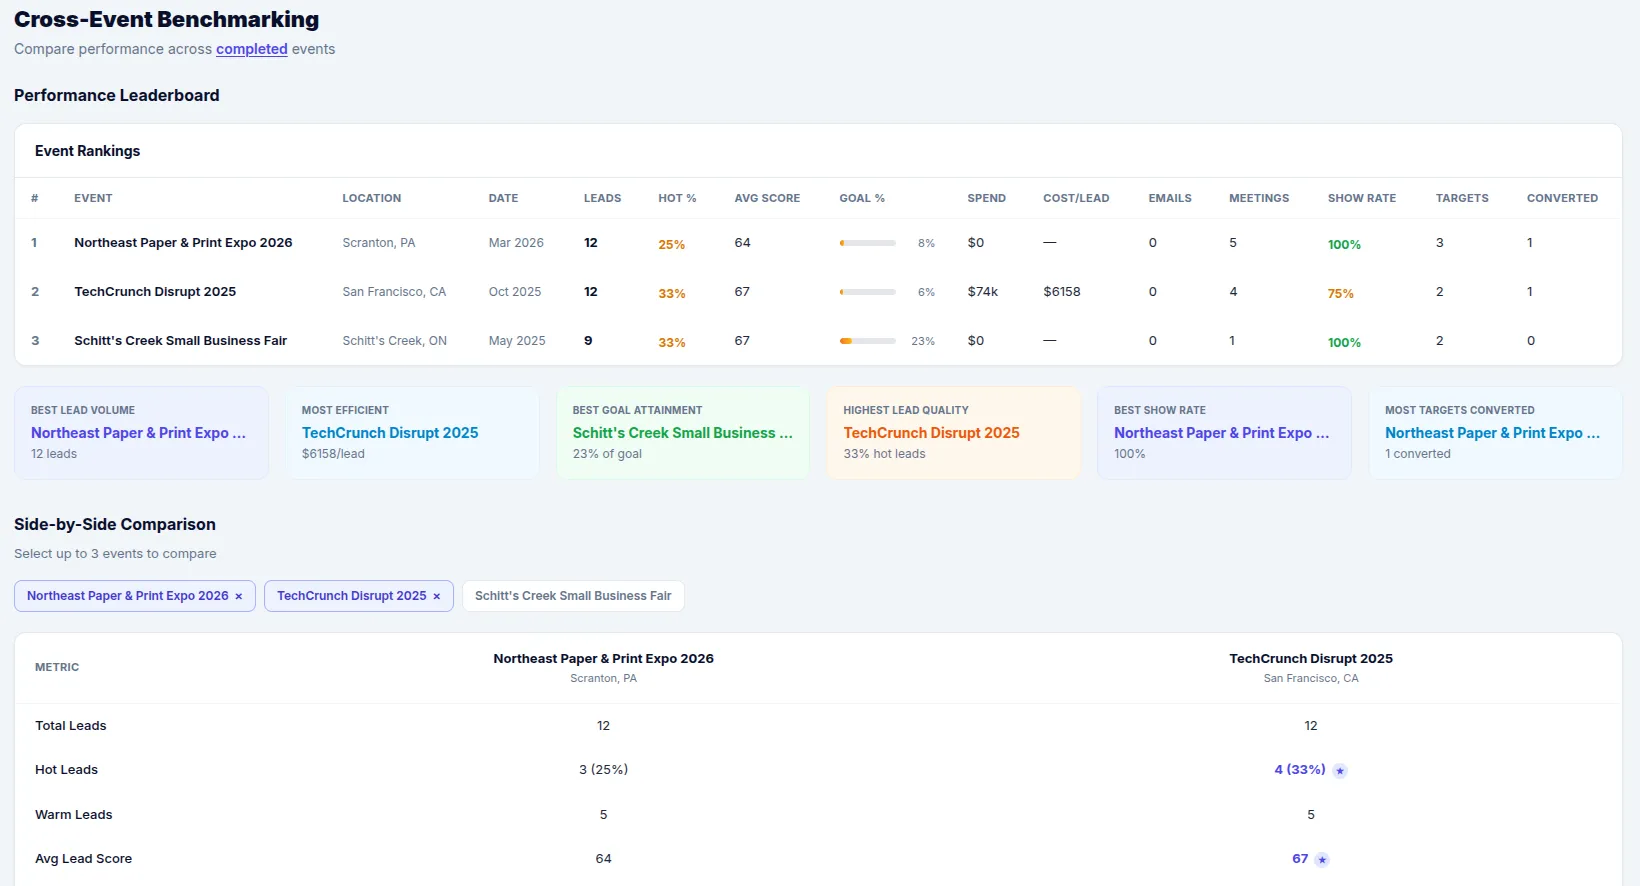
When you attend multiple events per year, it's important to know which ones actually deliver results. Conference Hero's benchmarking feature compares lead volume, cost-per-lead, conversion rates, and follow-up performance across all your conferences. Spot your top-performing events quickly and allocate next year's budget accordingly.
Benchmarking data accumulates over time, so the longer you use Conference Hero, the richer your comparative insights become. After two or three event cycles, you'll have a clear picture of which conferences deserve a bigger investment and which ones aren't pulling their weight.